The Office Character Word Frequency
Recently I posted this picture:
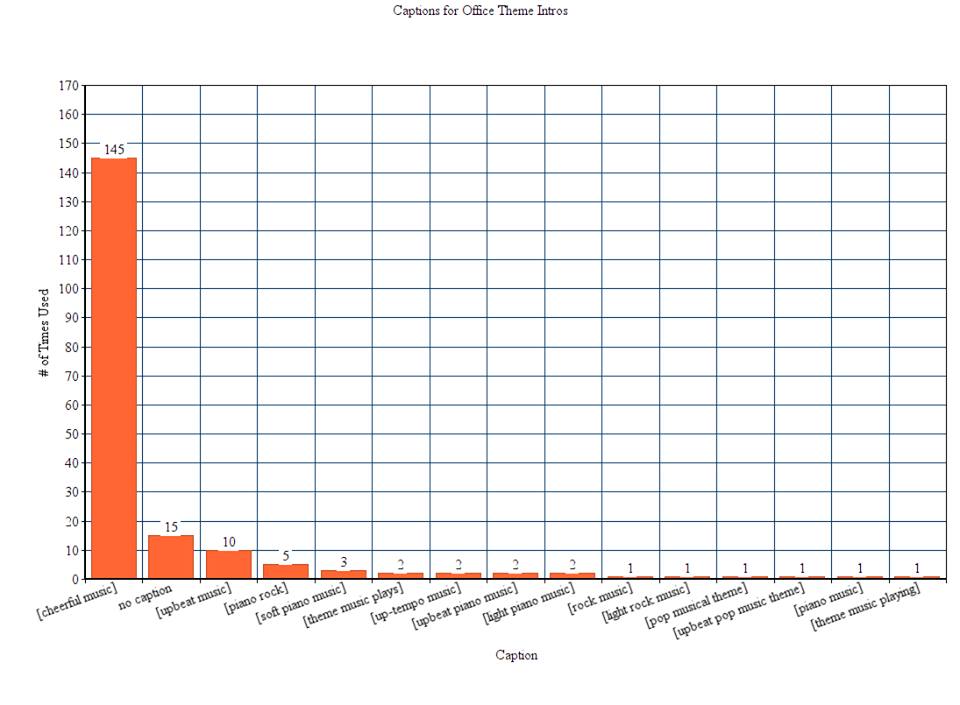
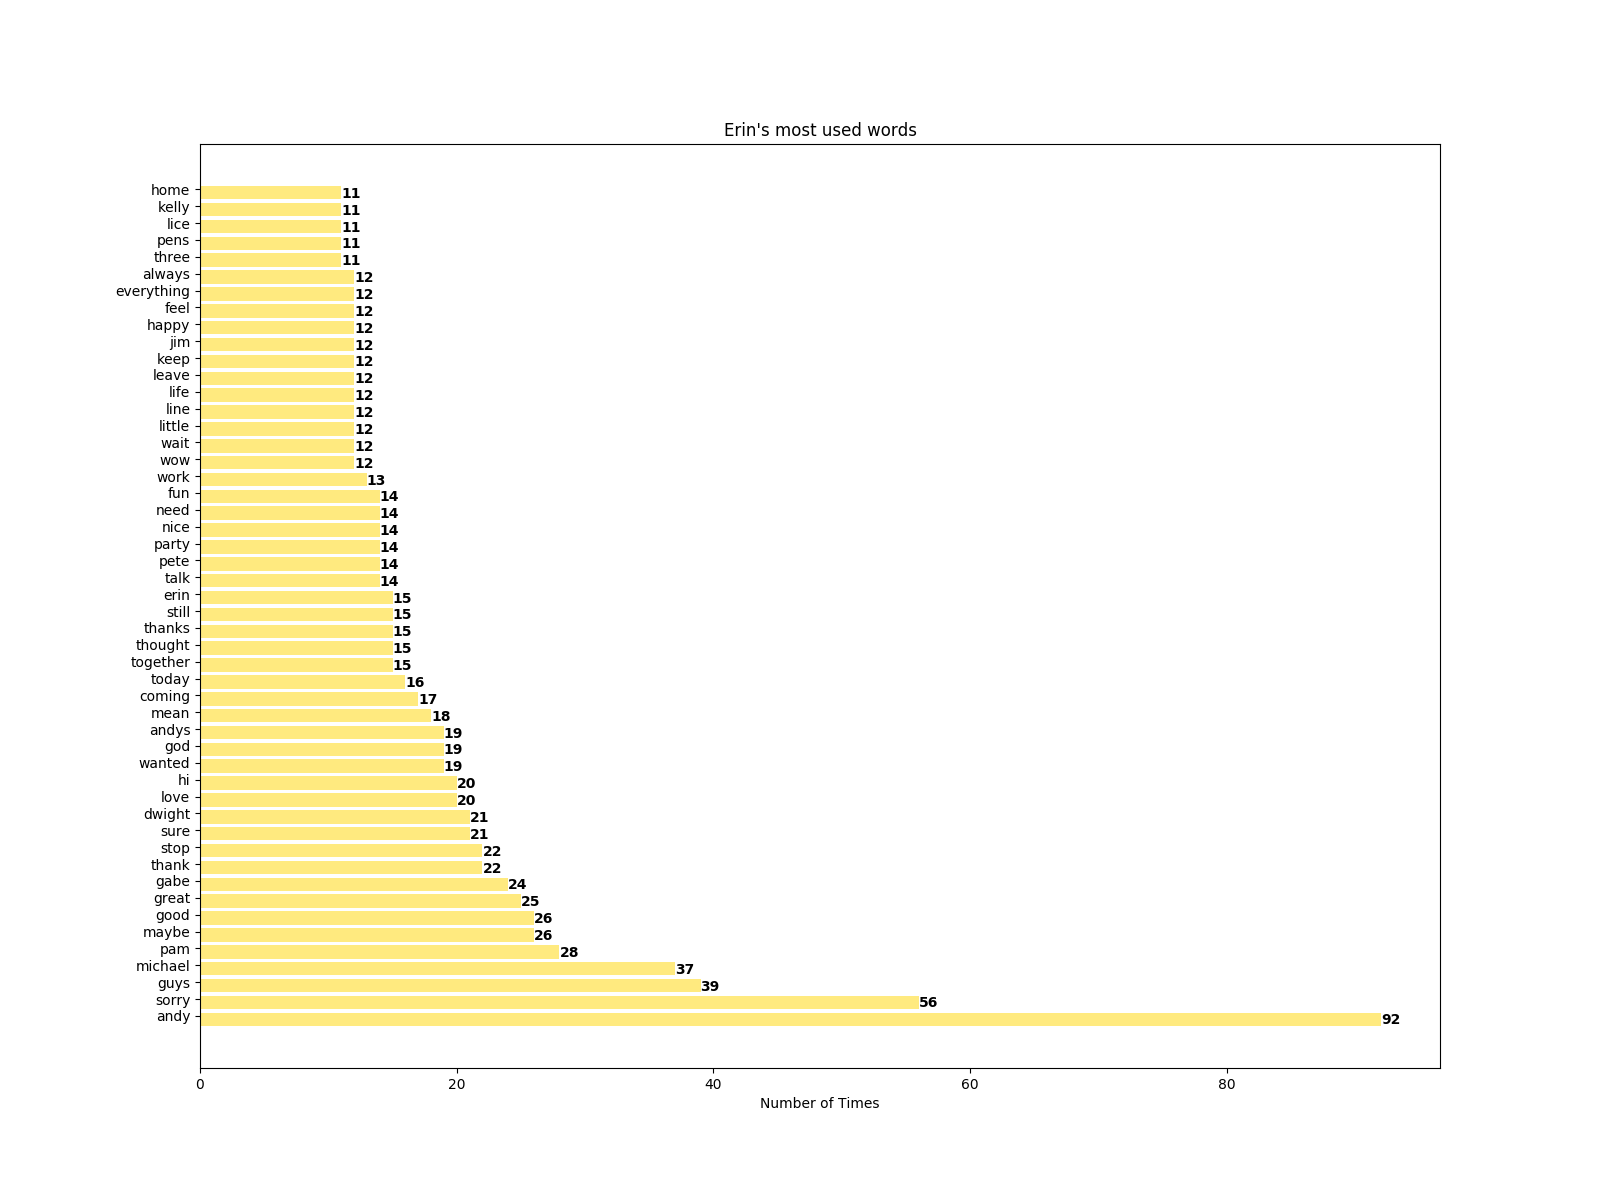
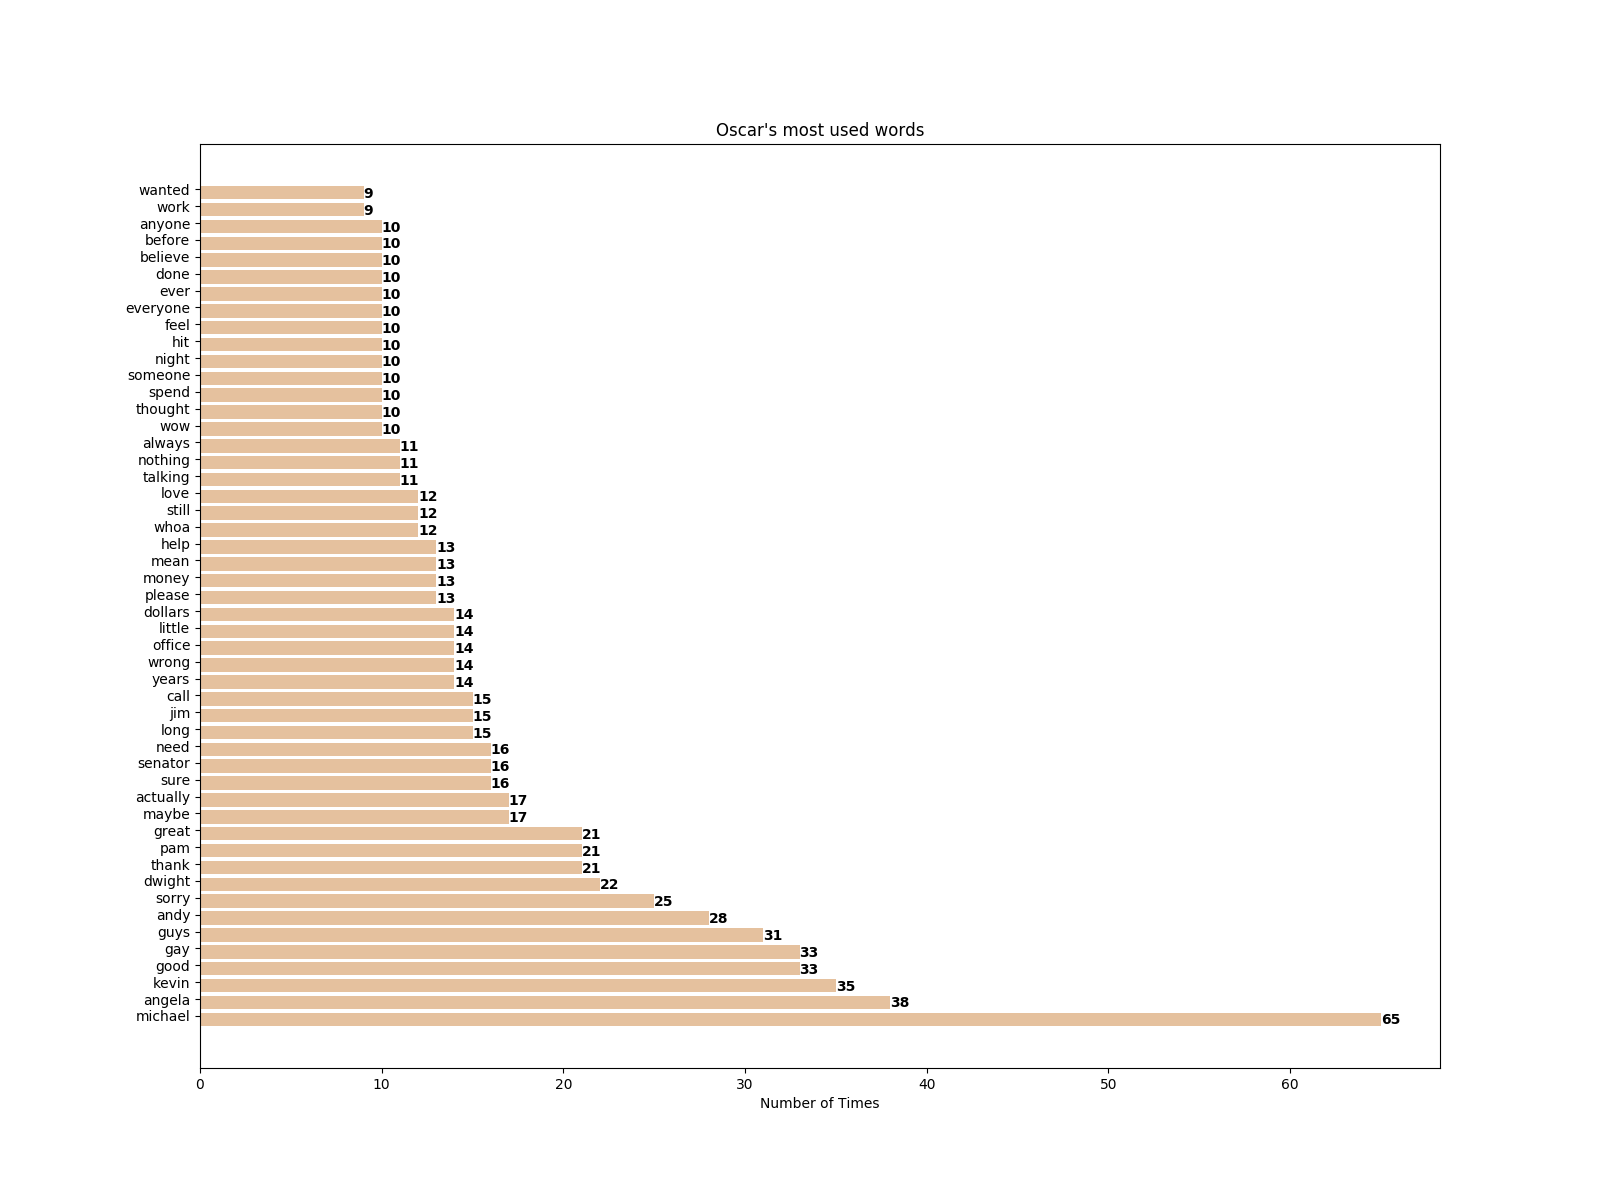
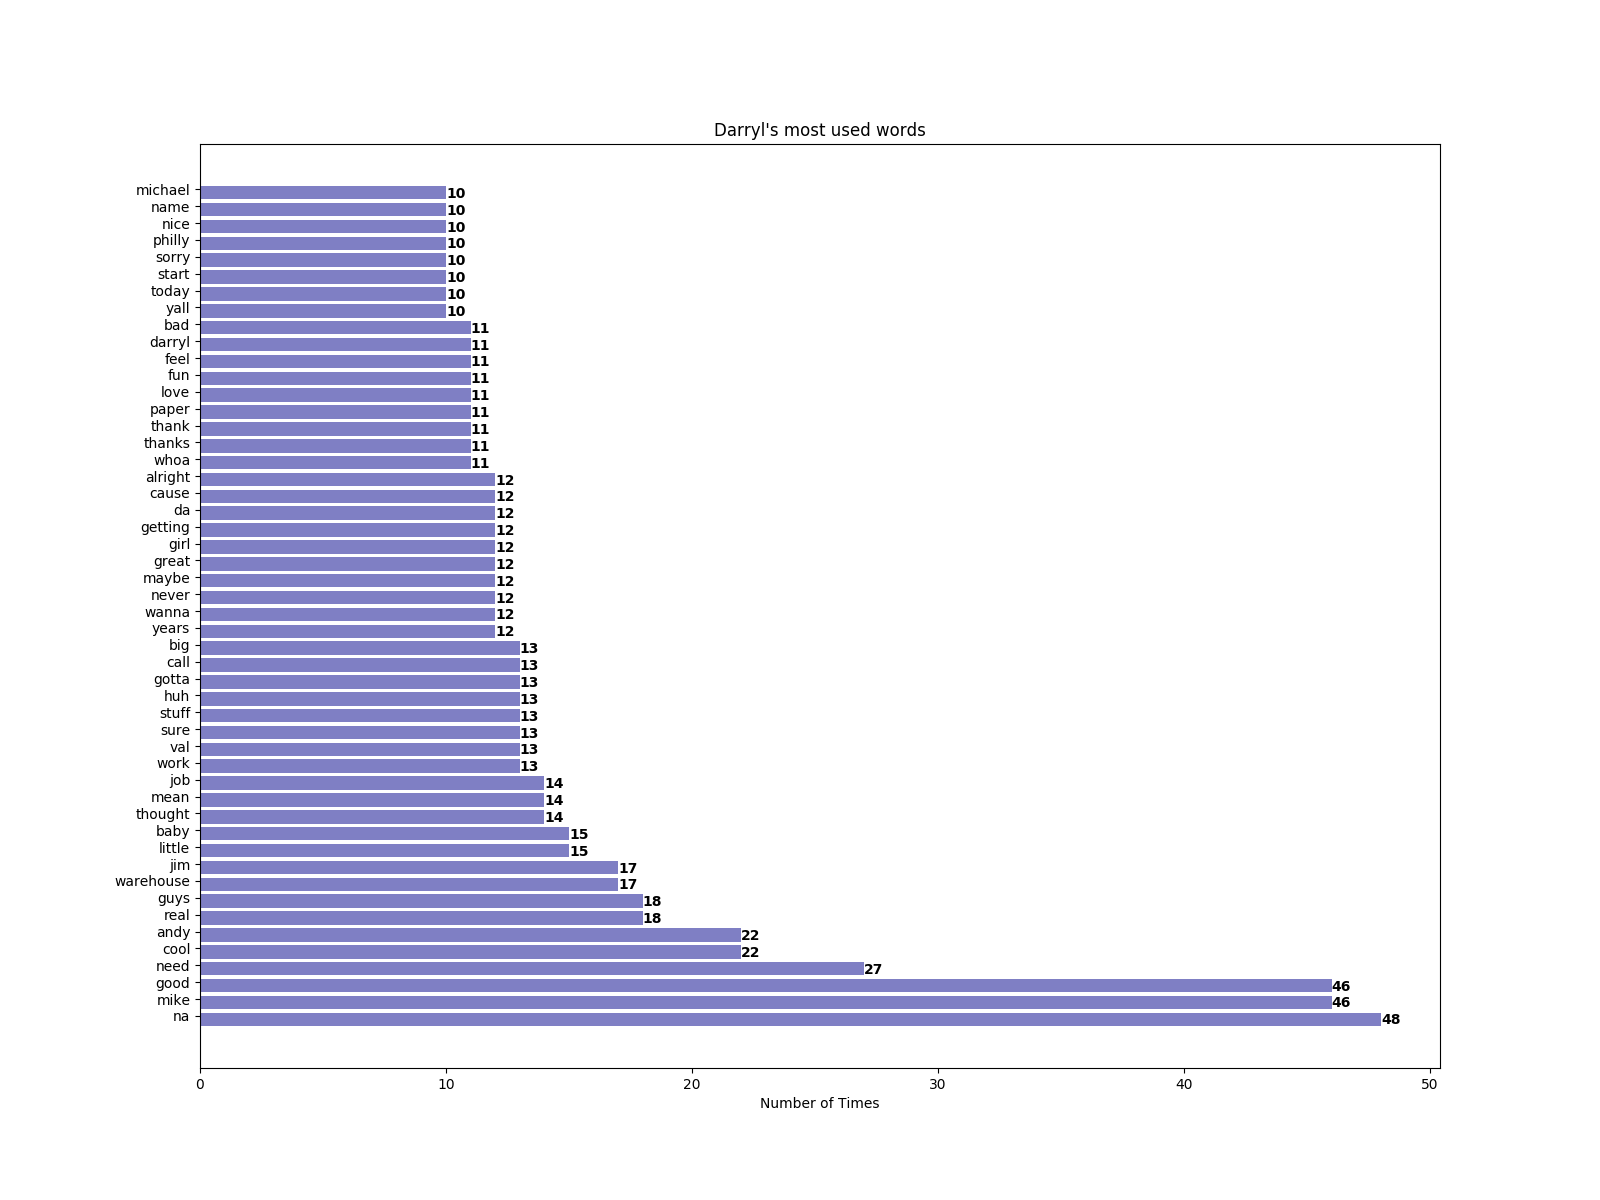
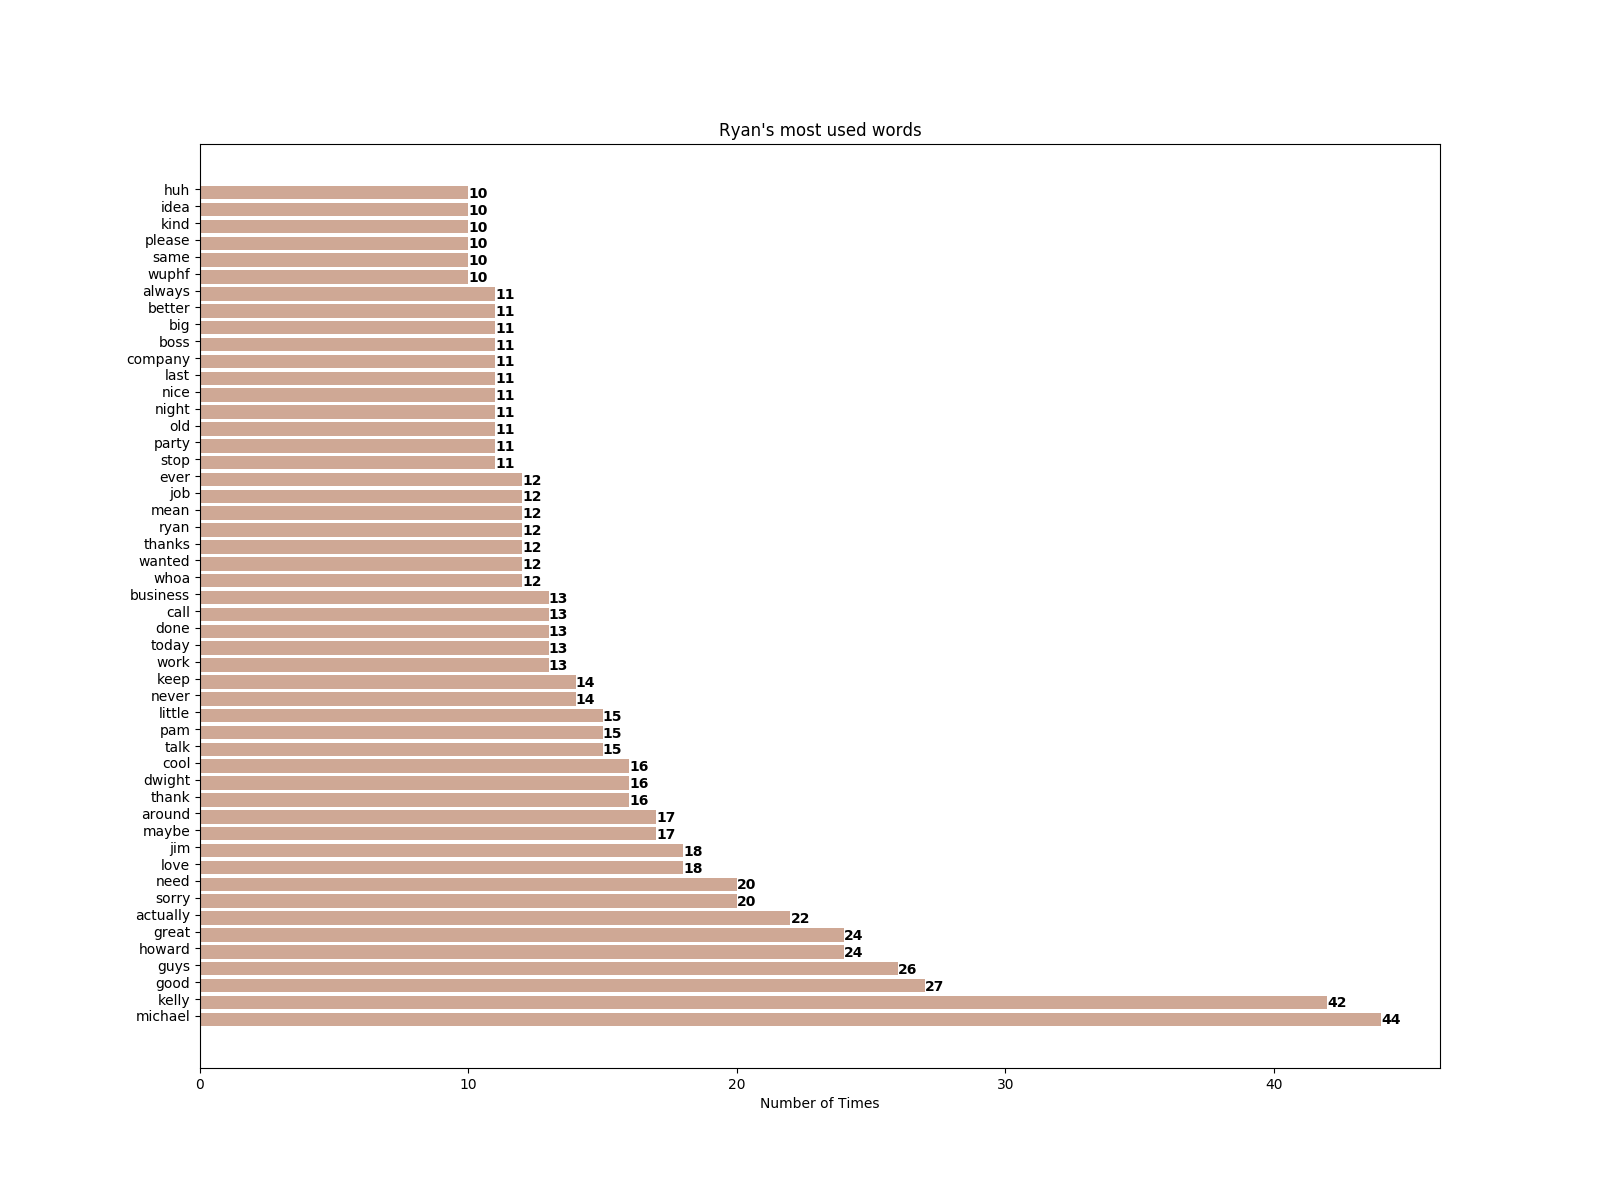
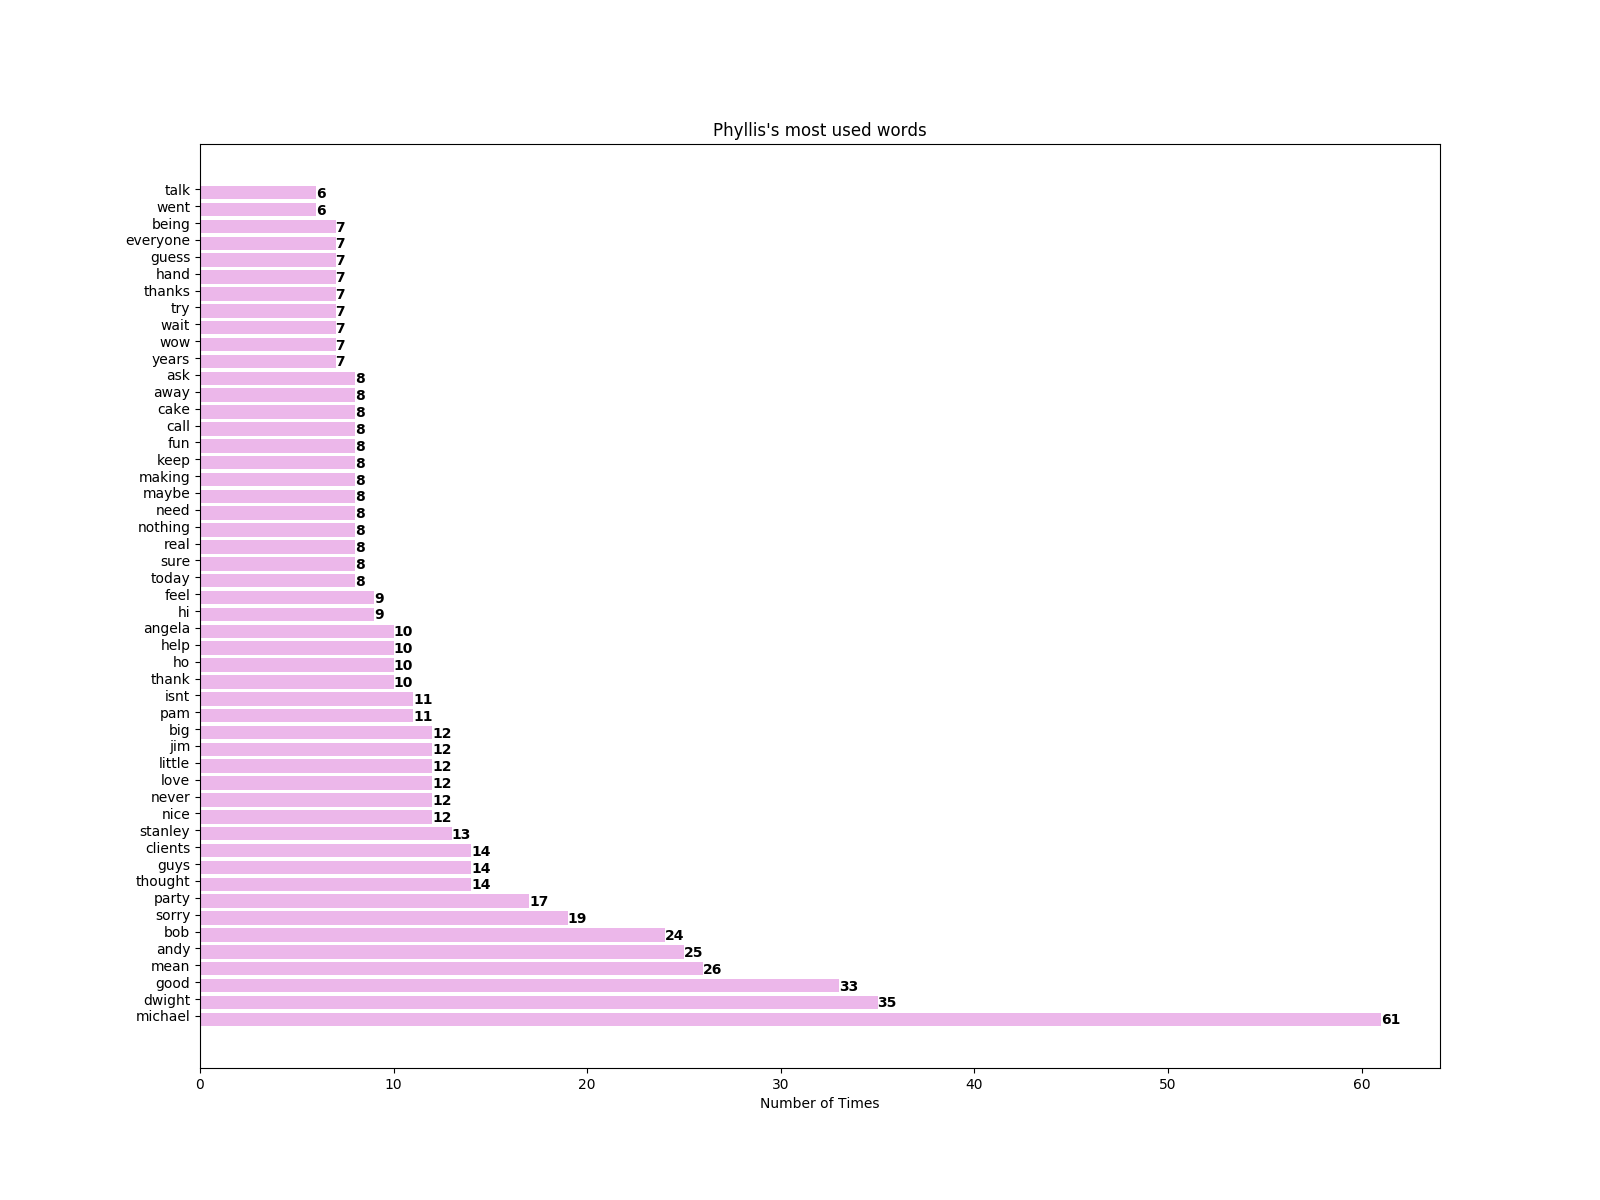
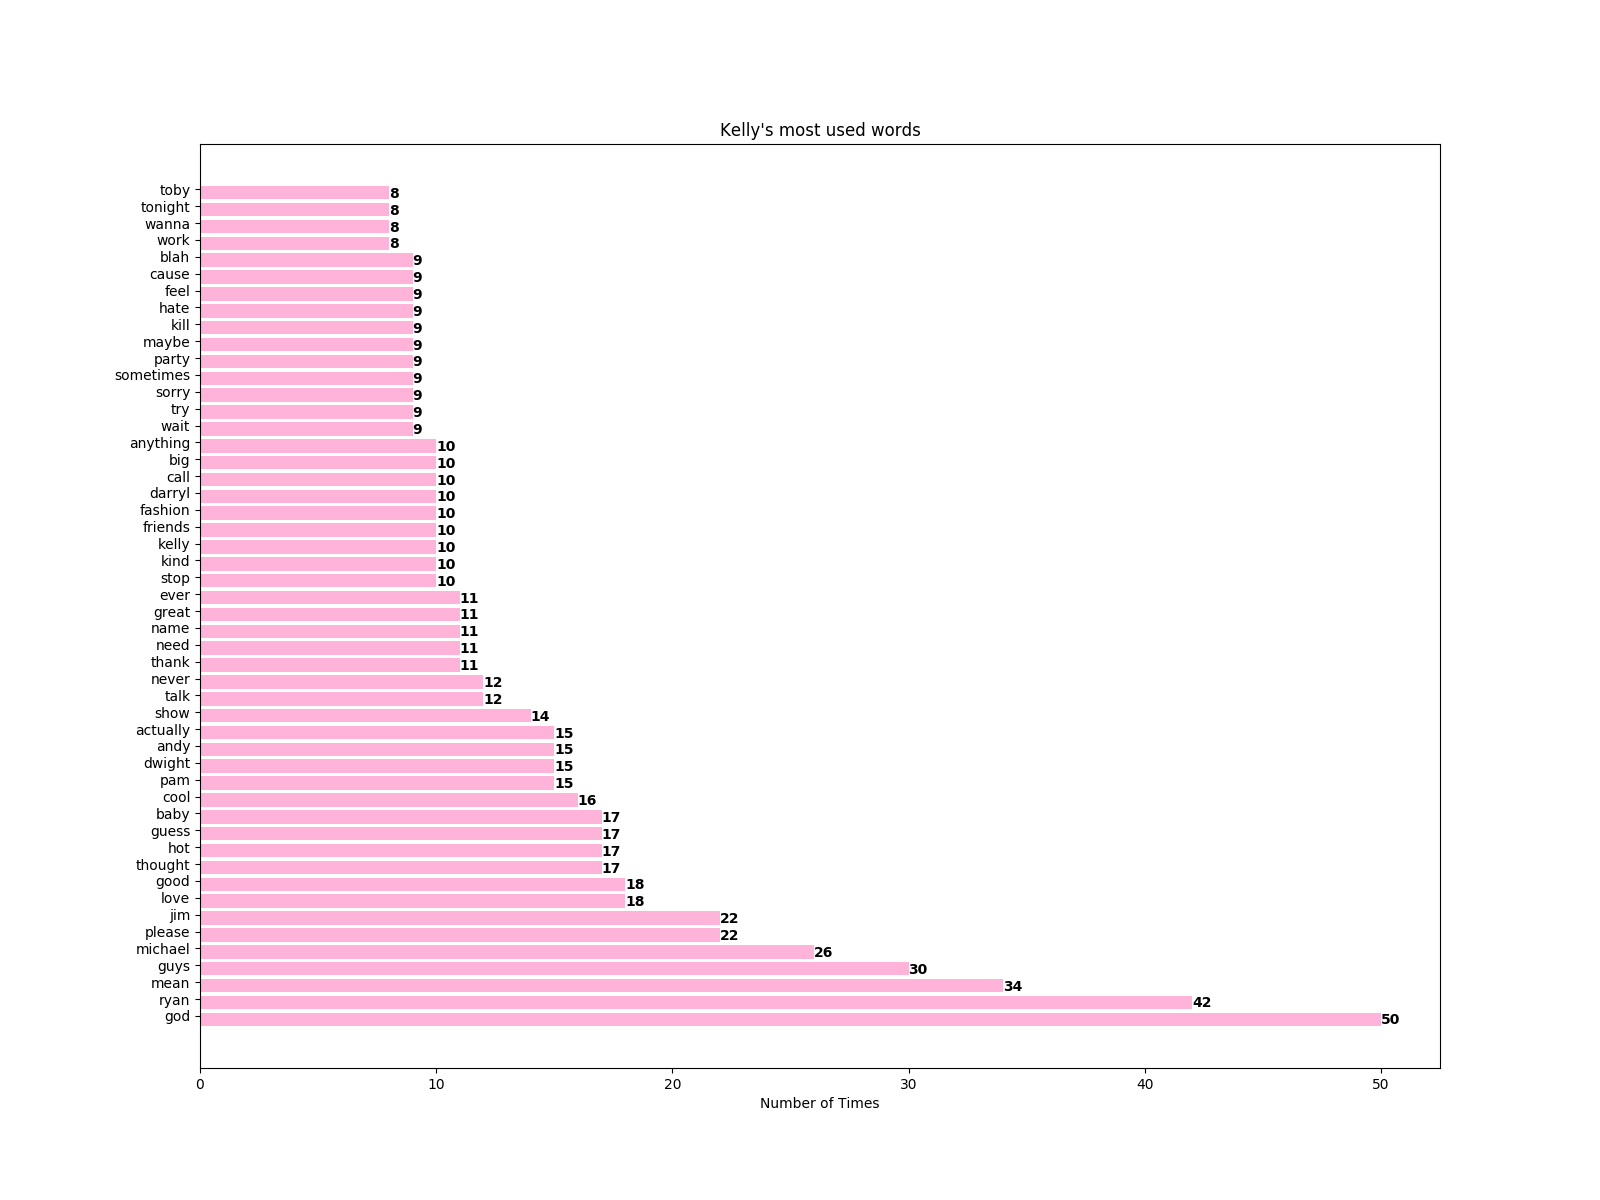
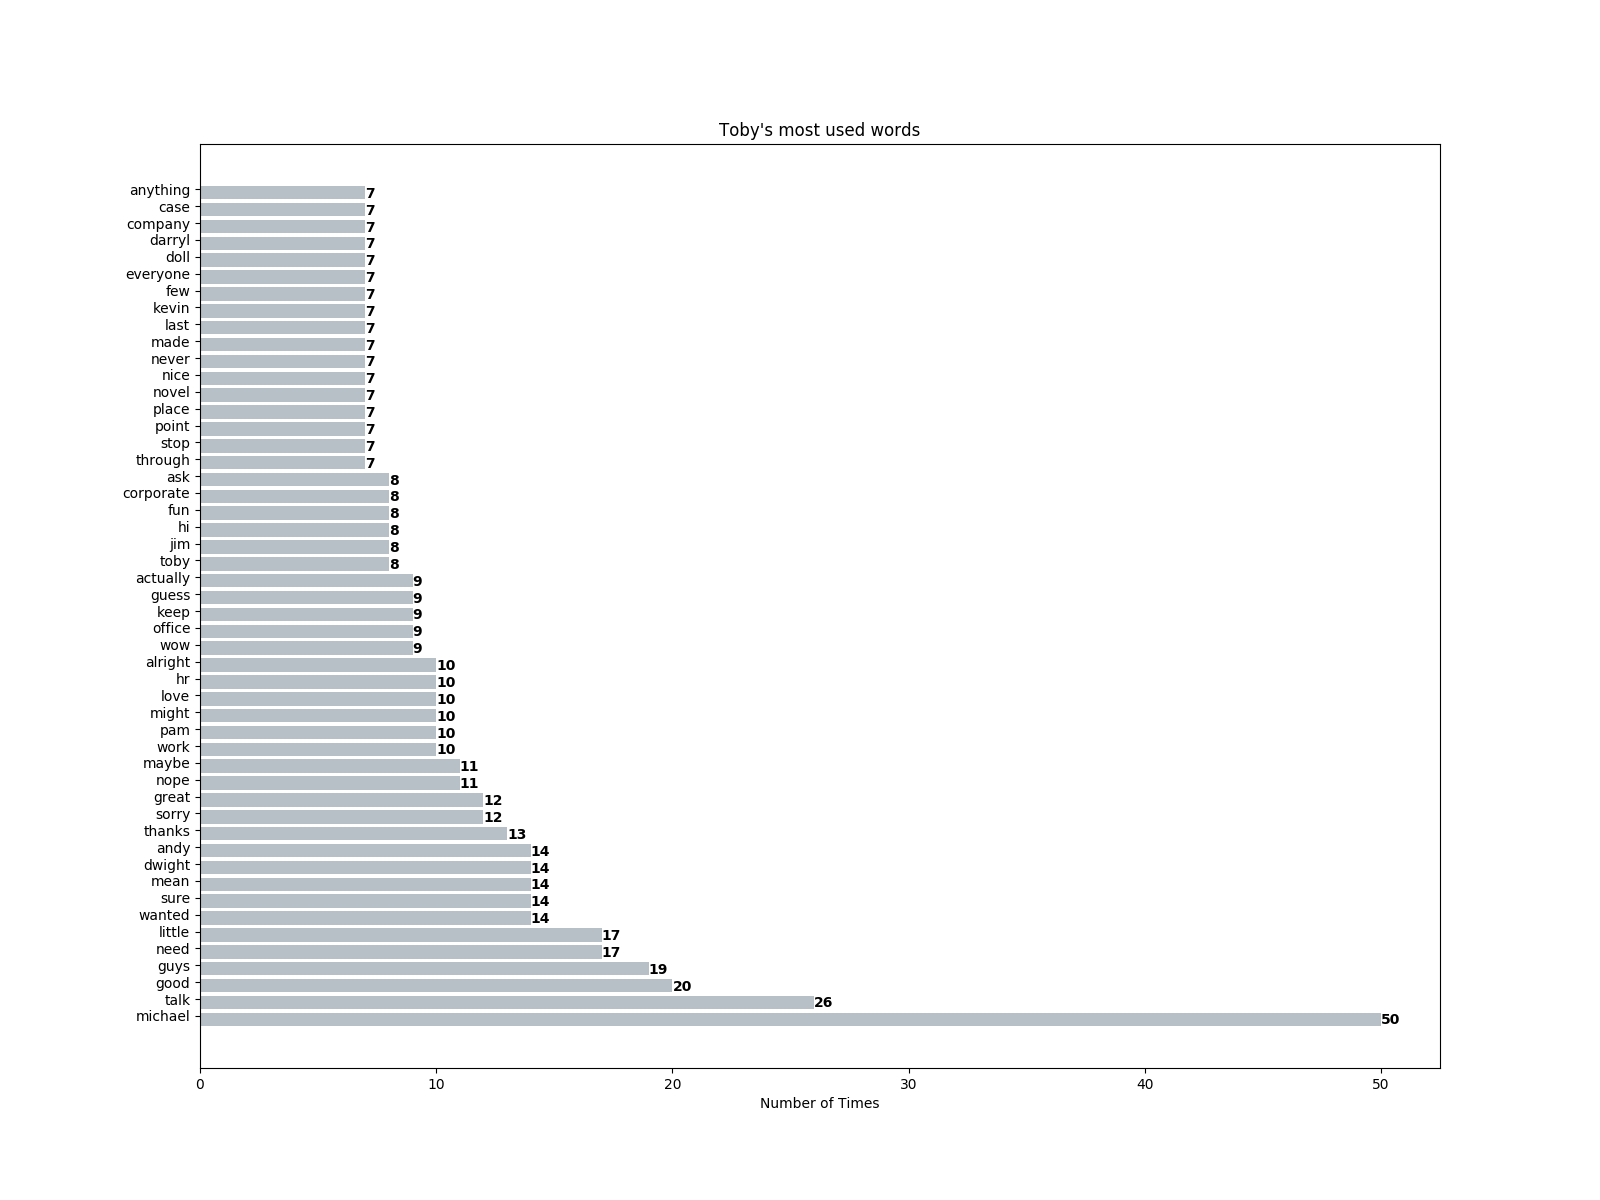
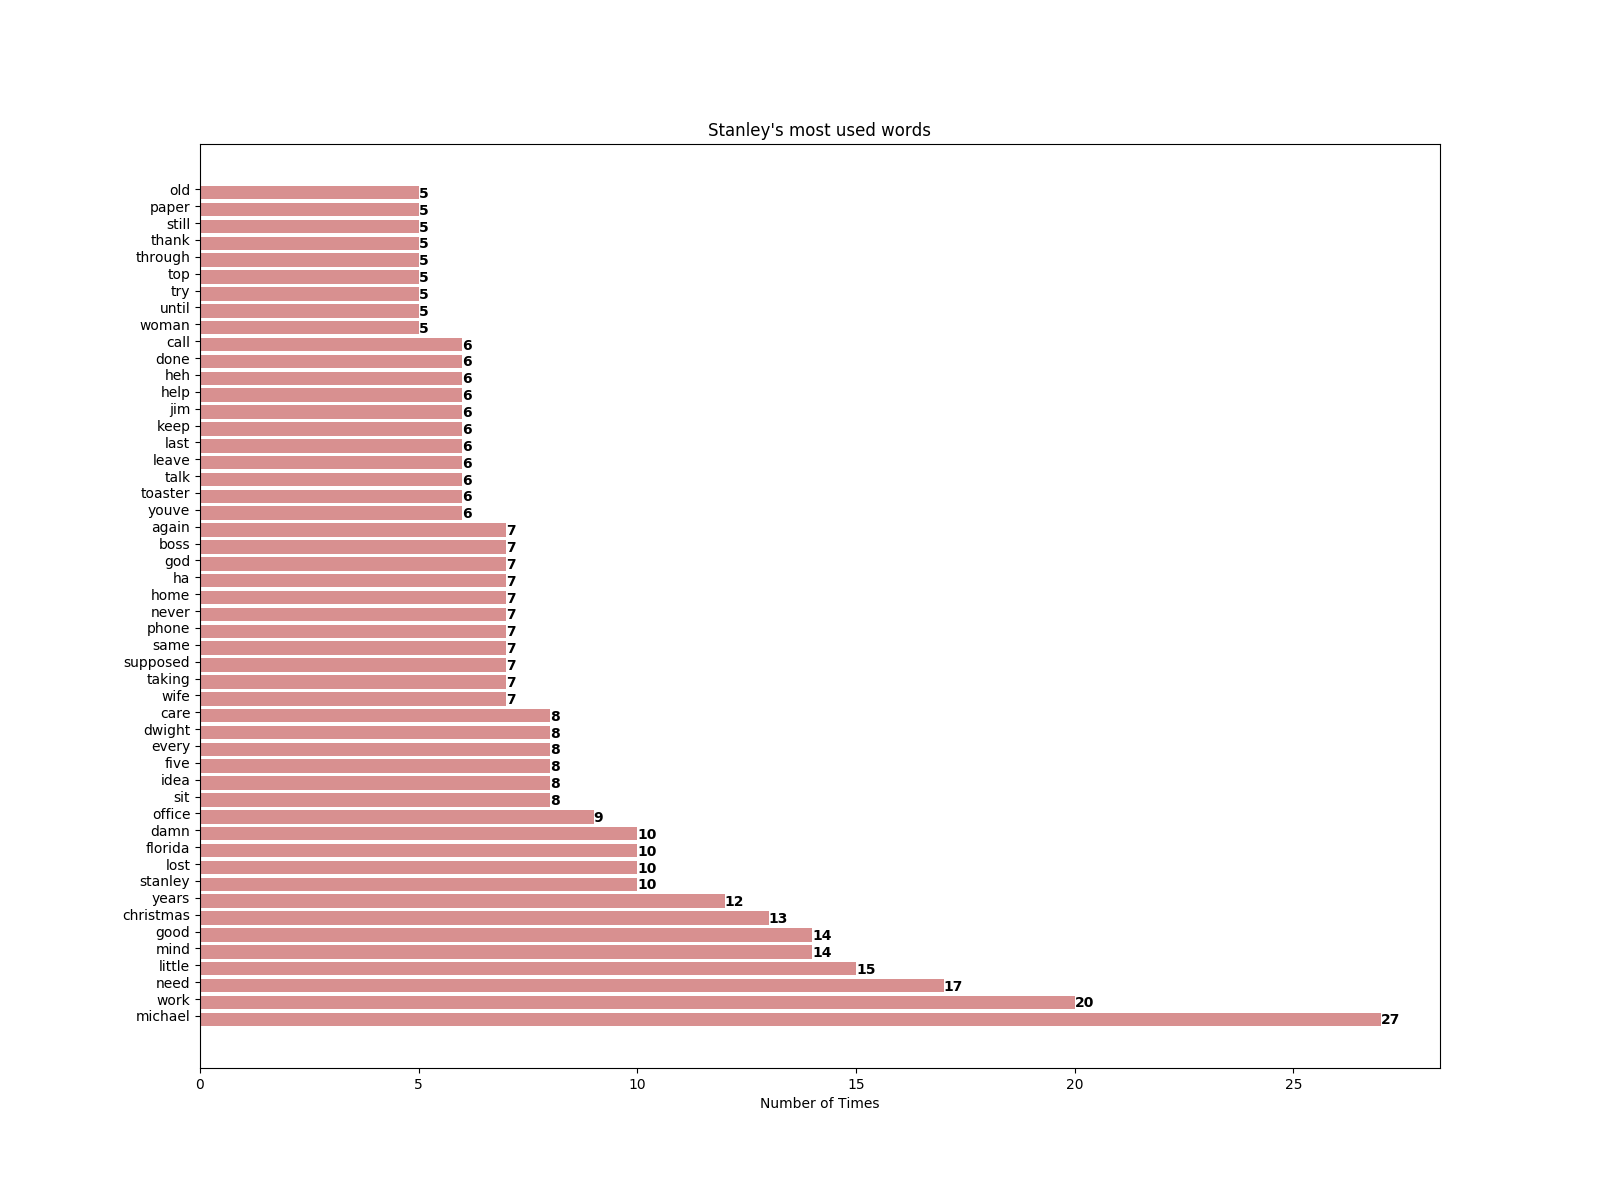
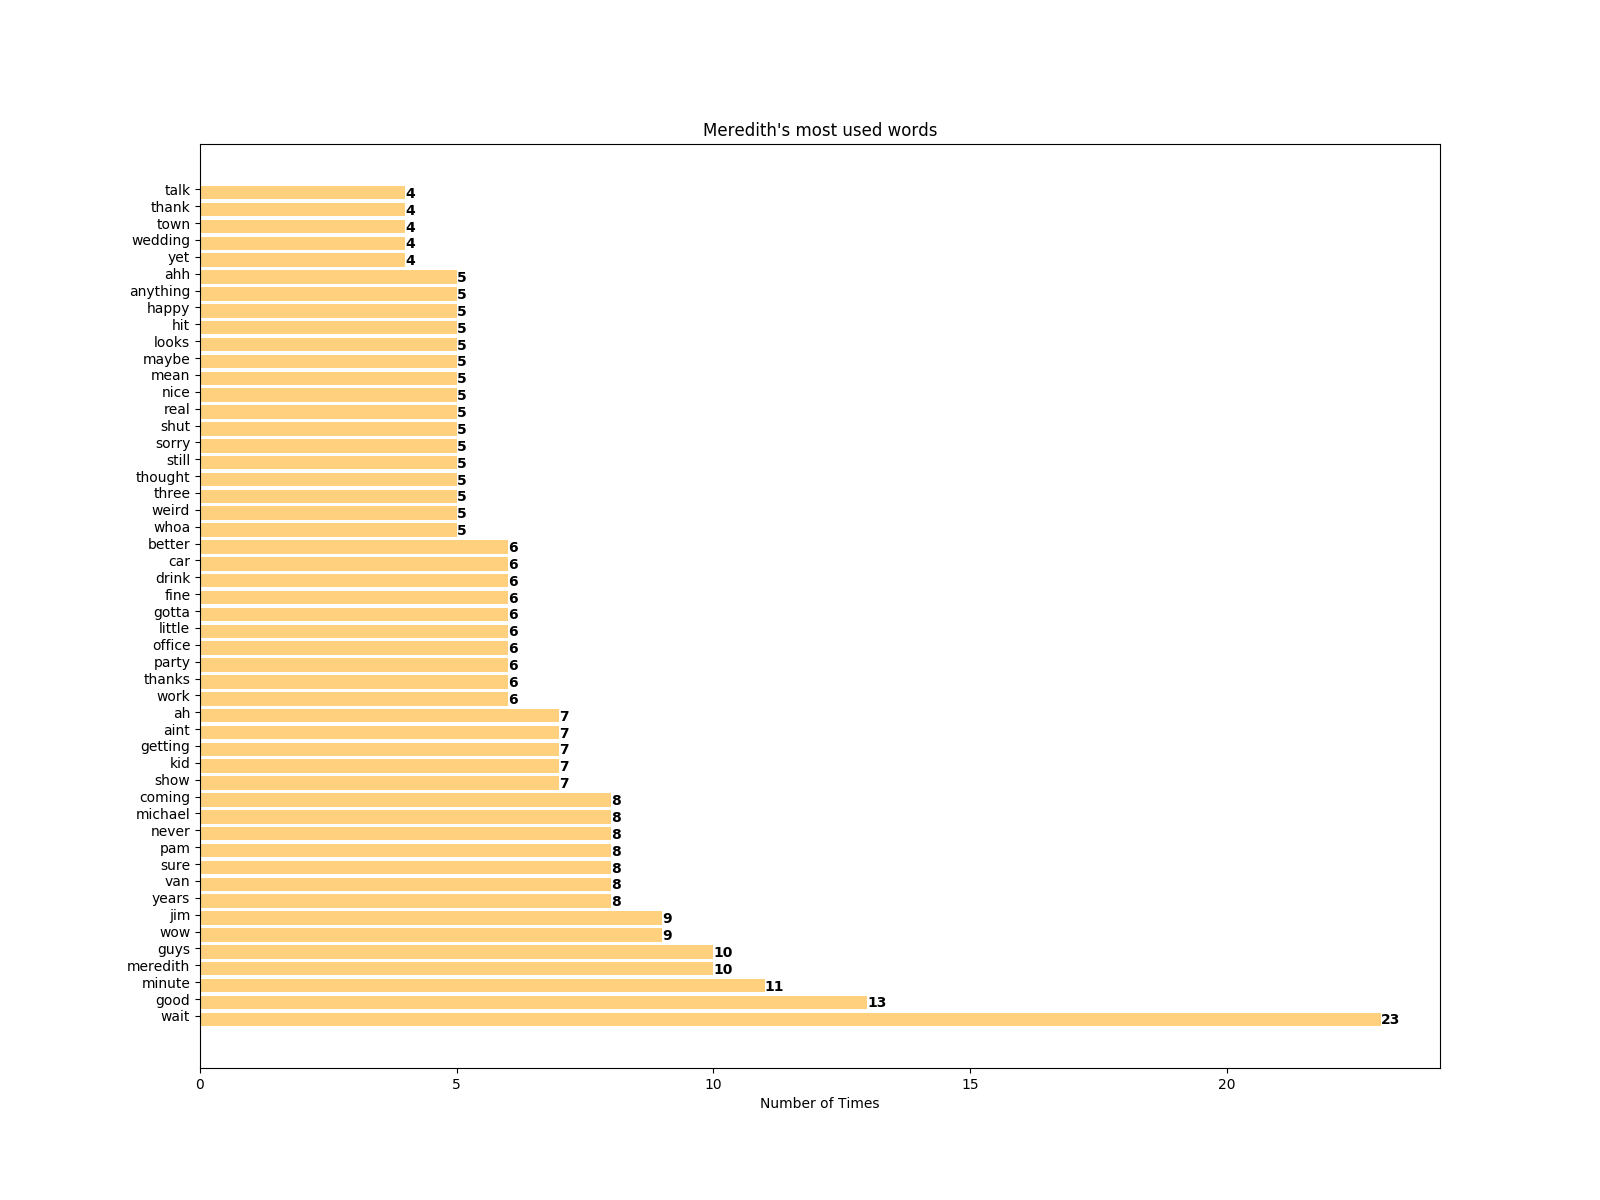
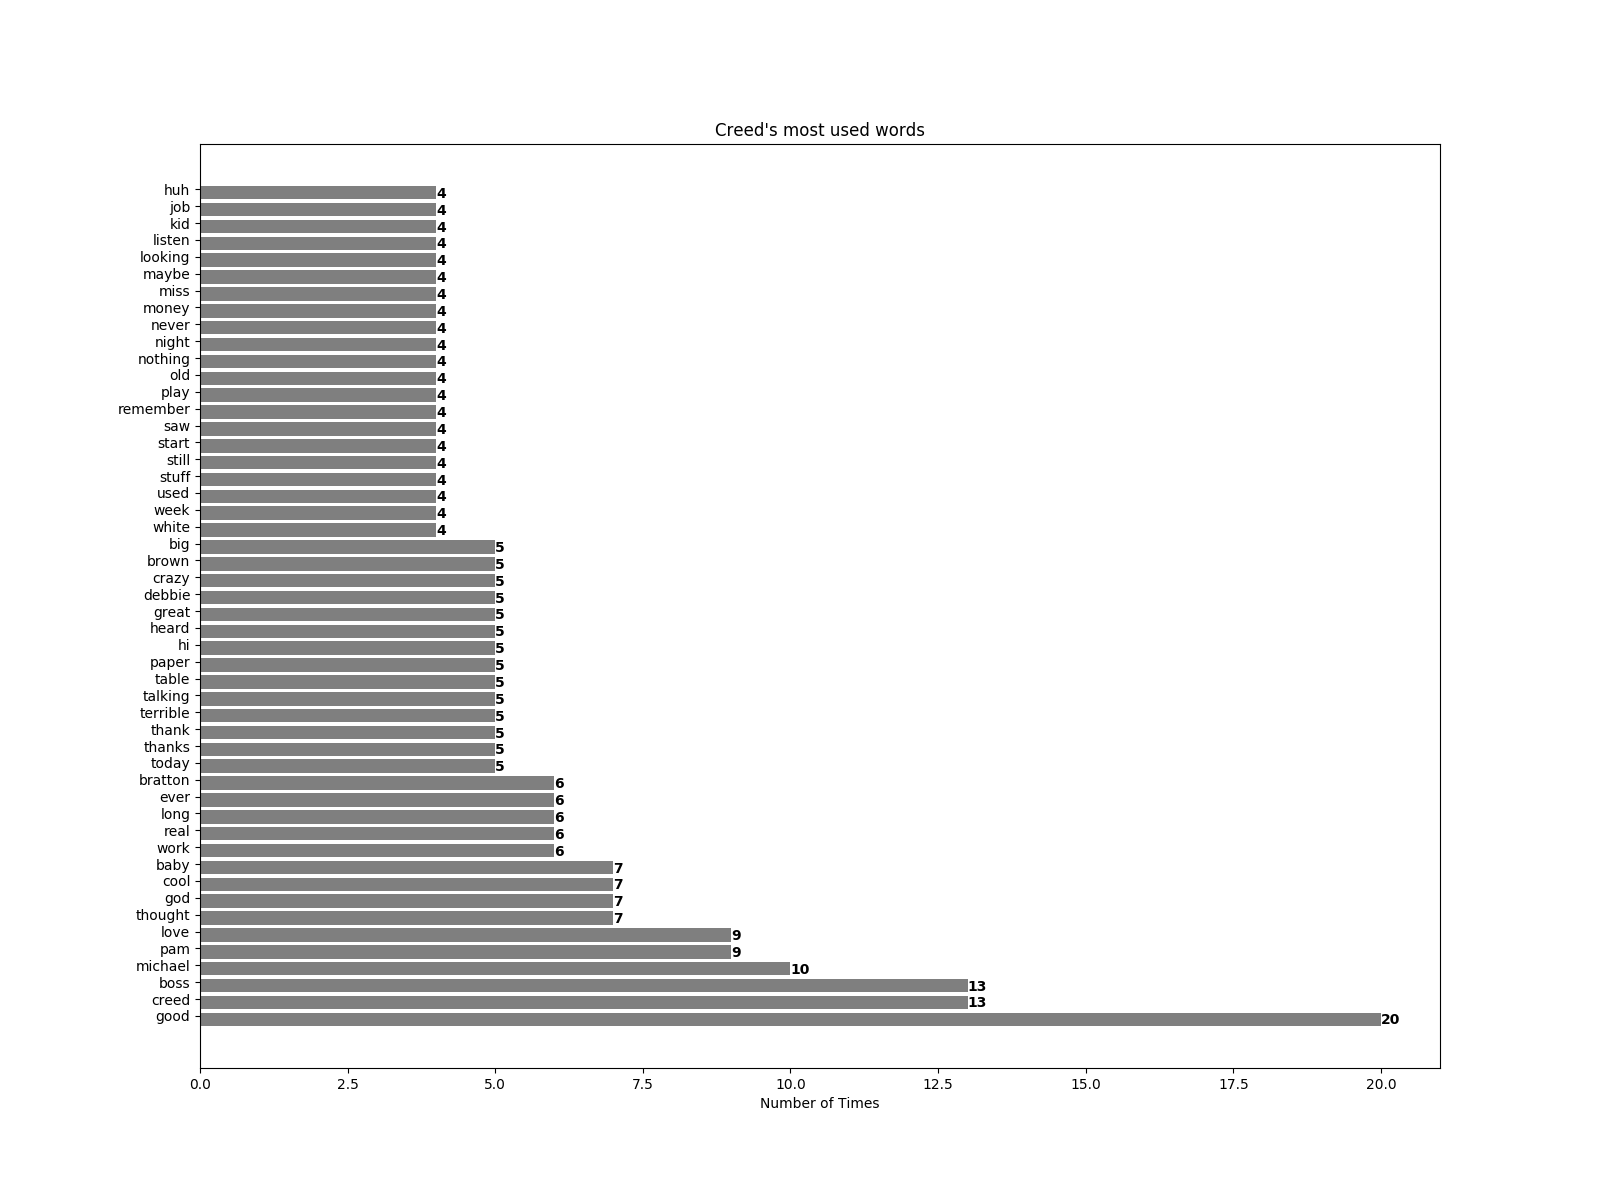
On my Facebook after manually going through every episode of the office and checking how the captions presented the theme song when it came up, and people really enjoyed it. So I spent a few hours putting together a fun Python script that created bar graphs for each of the mains character’s most used words. Without further ado, here are the graphs (with technical discussion after):
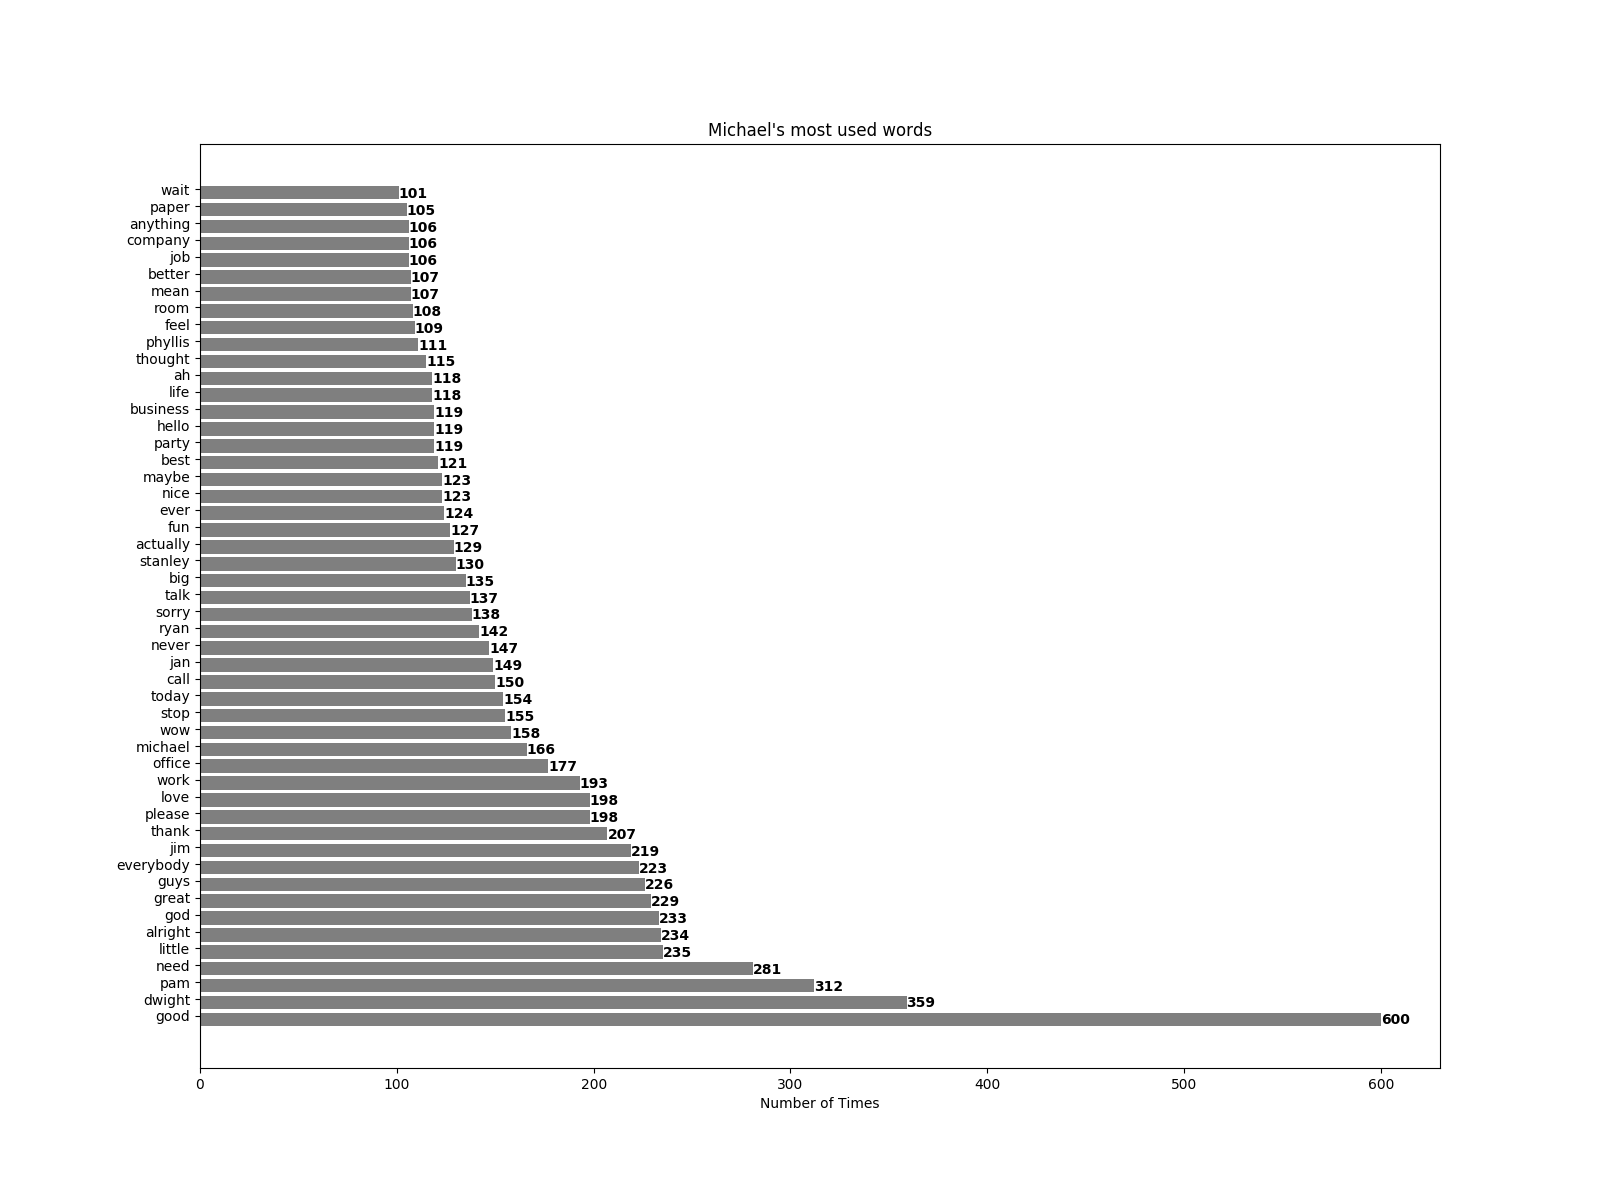
Michael:
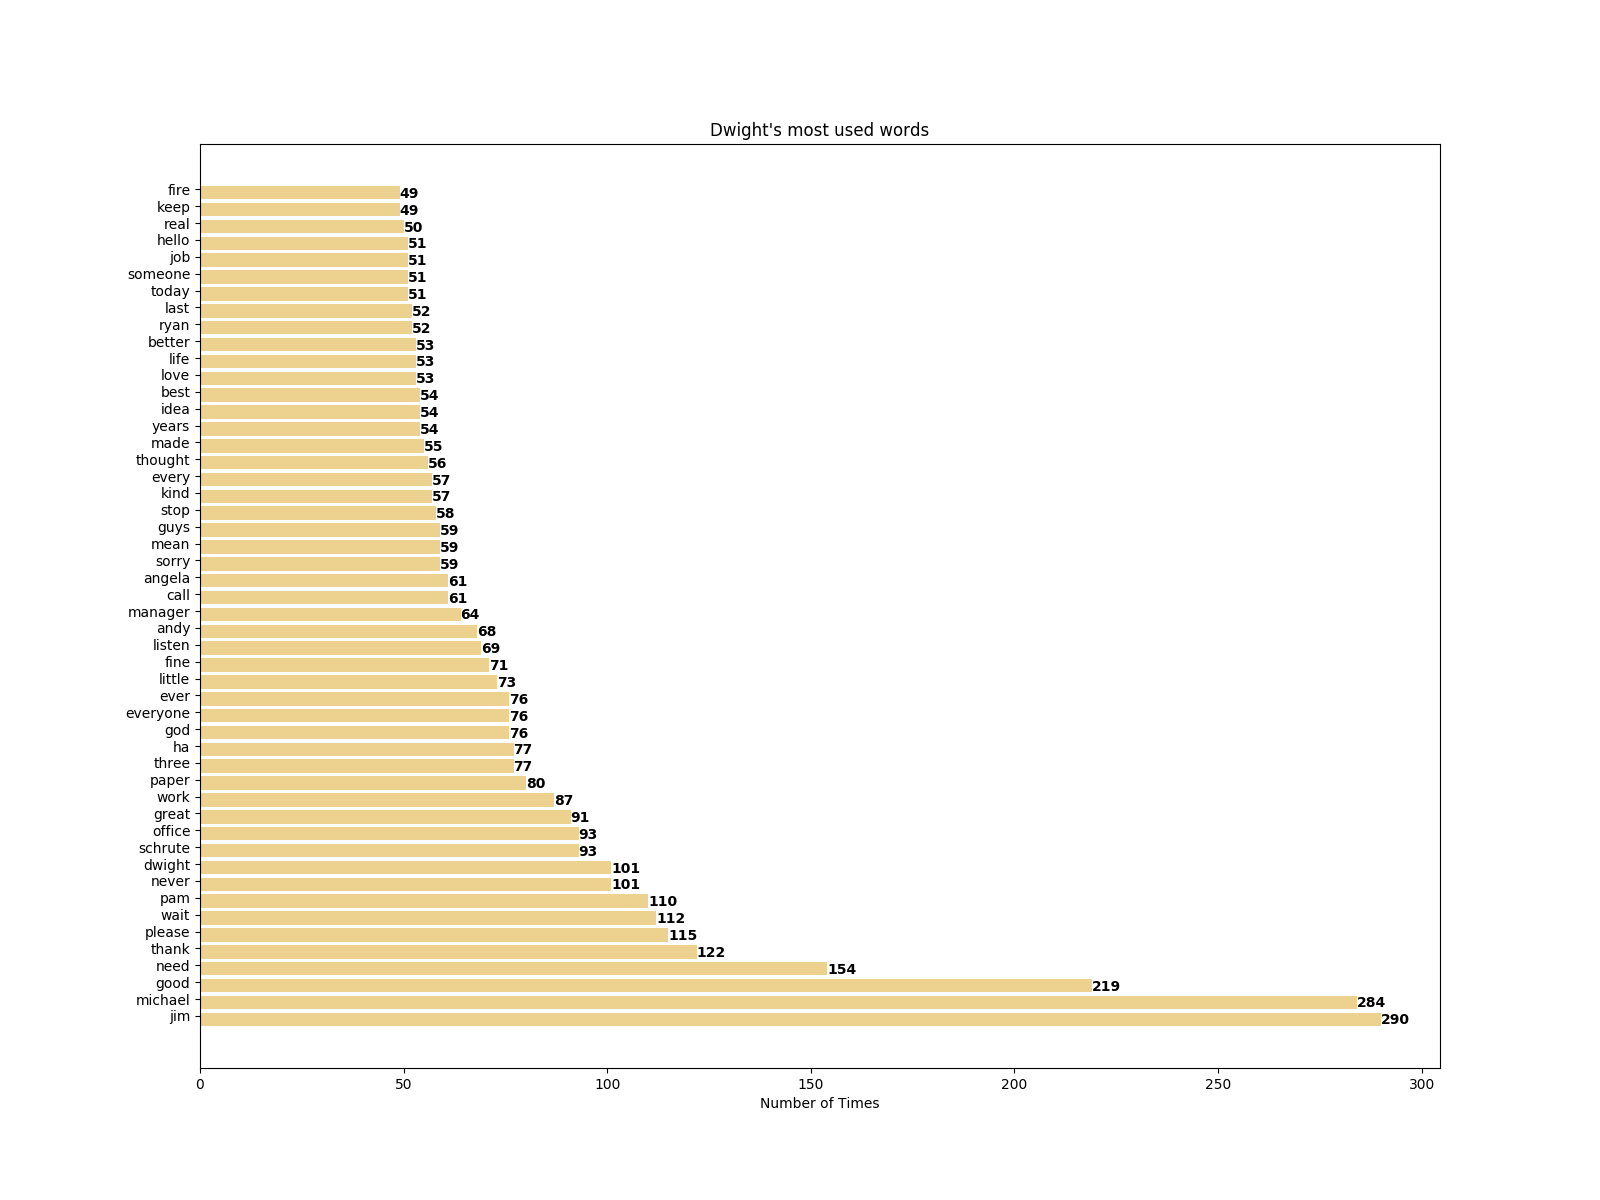
Dwight:
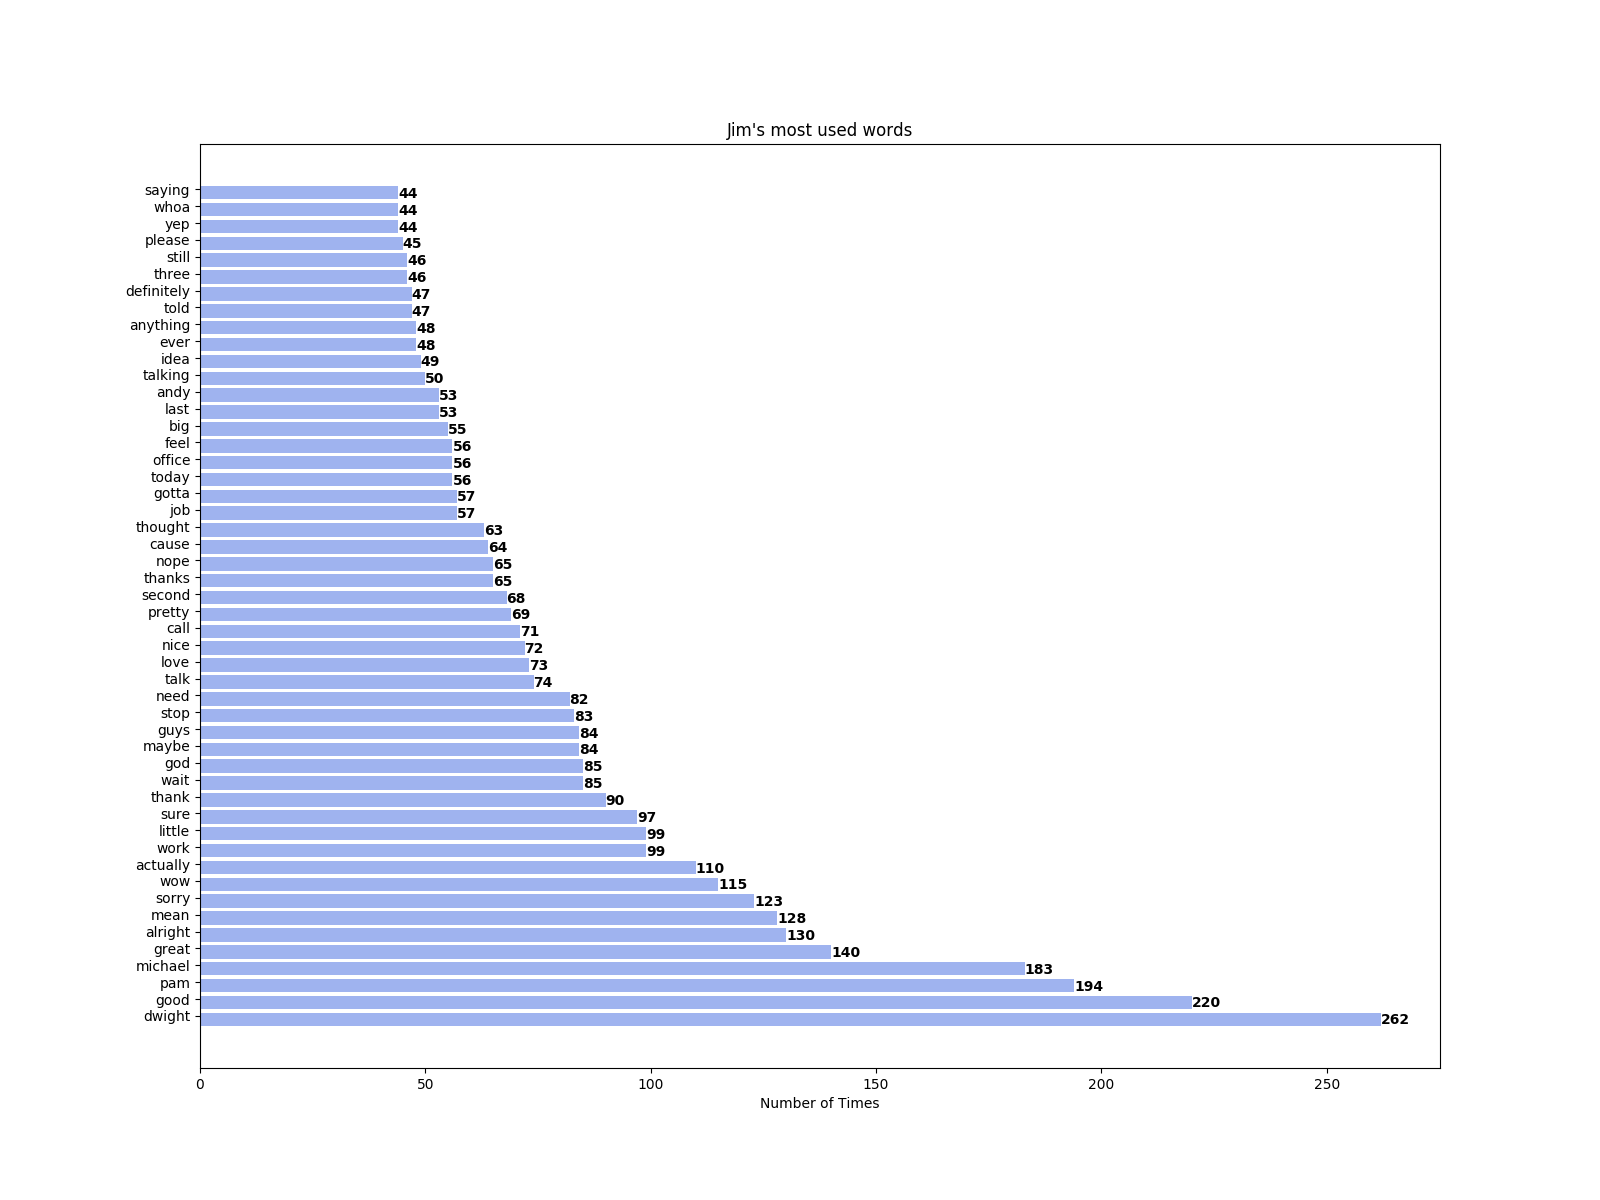
Jim:
Pam:
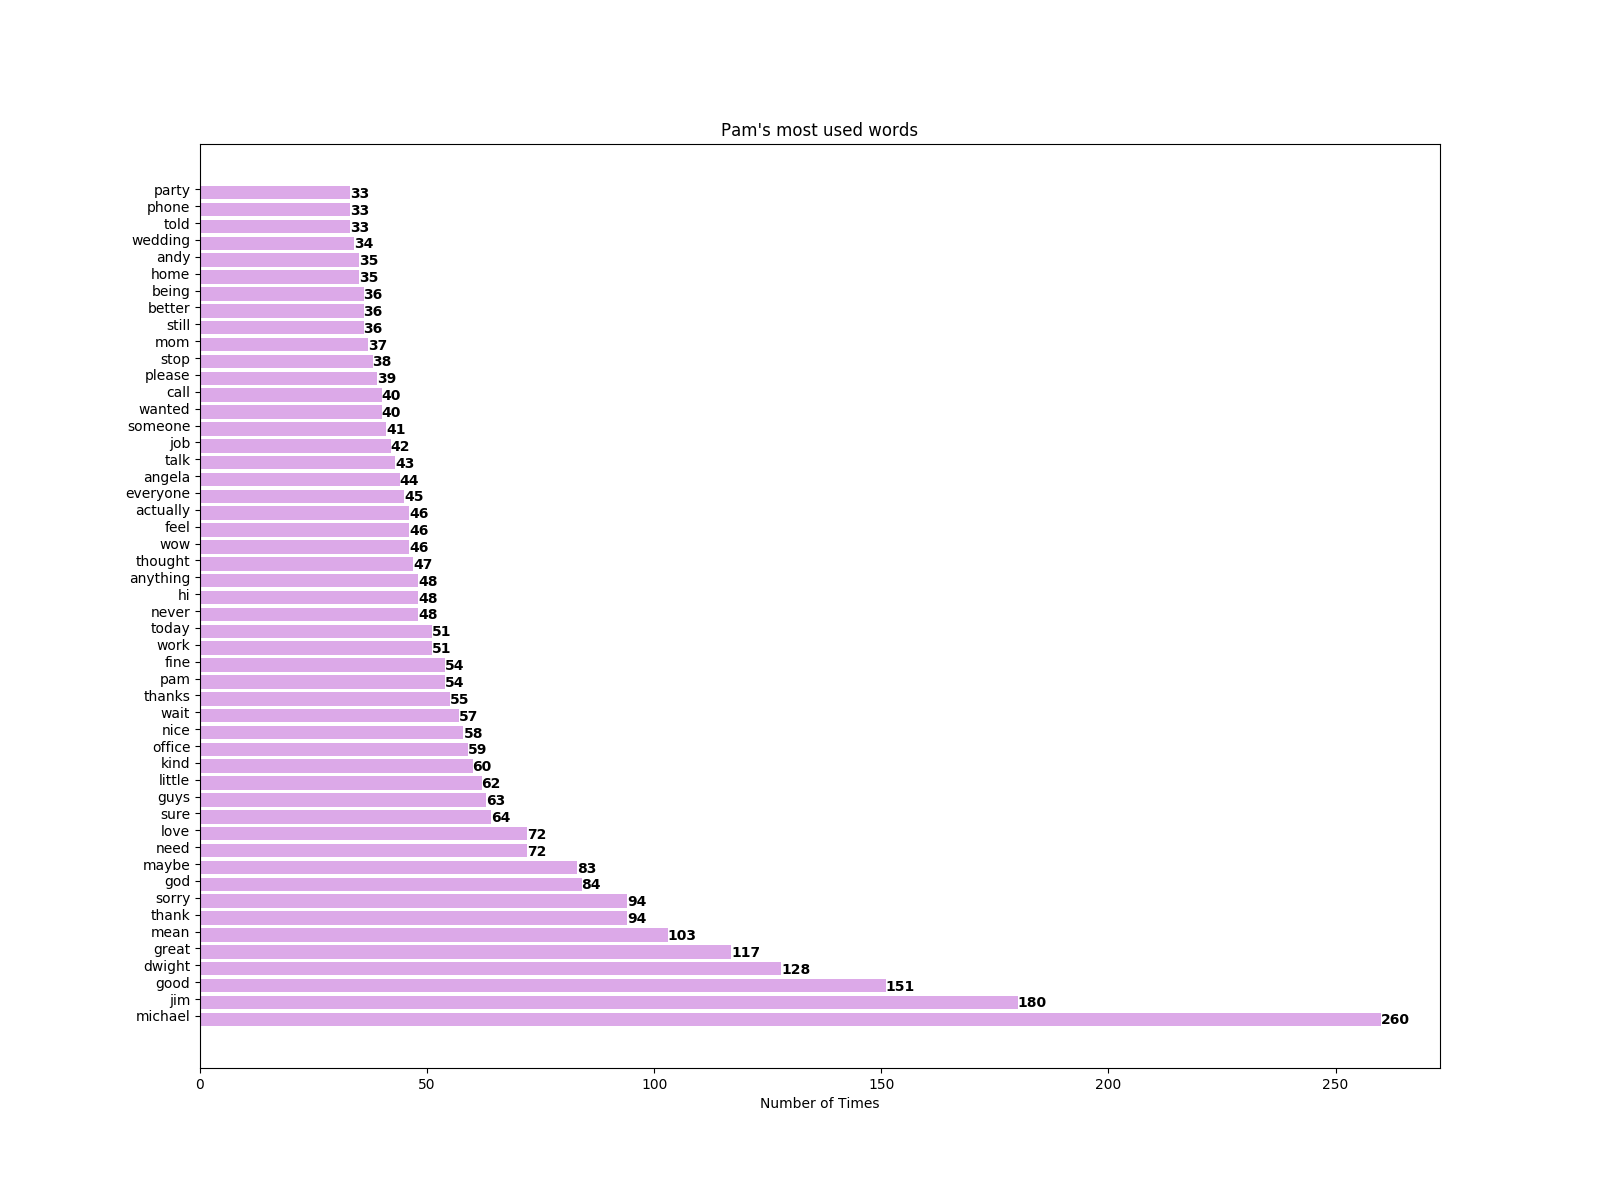
Andy:
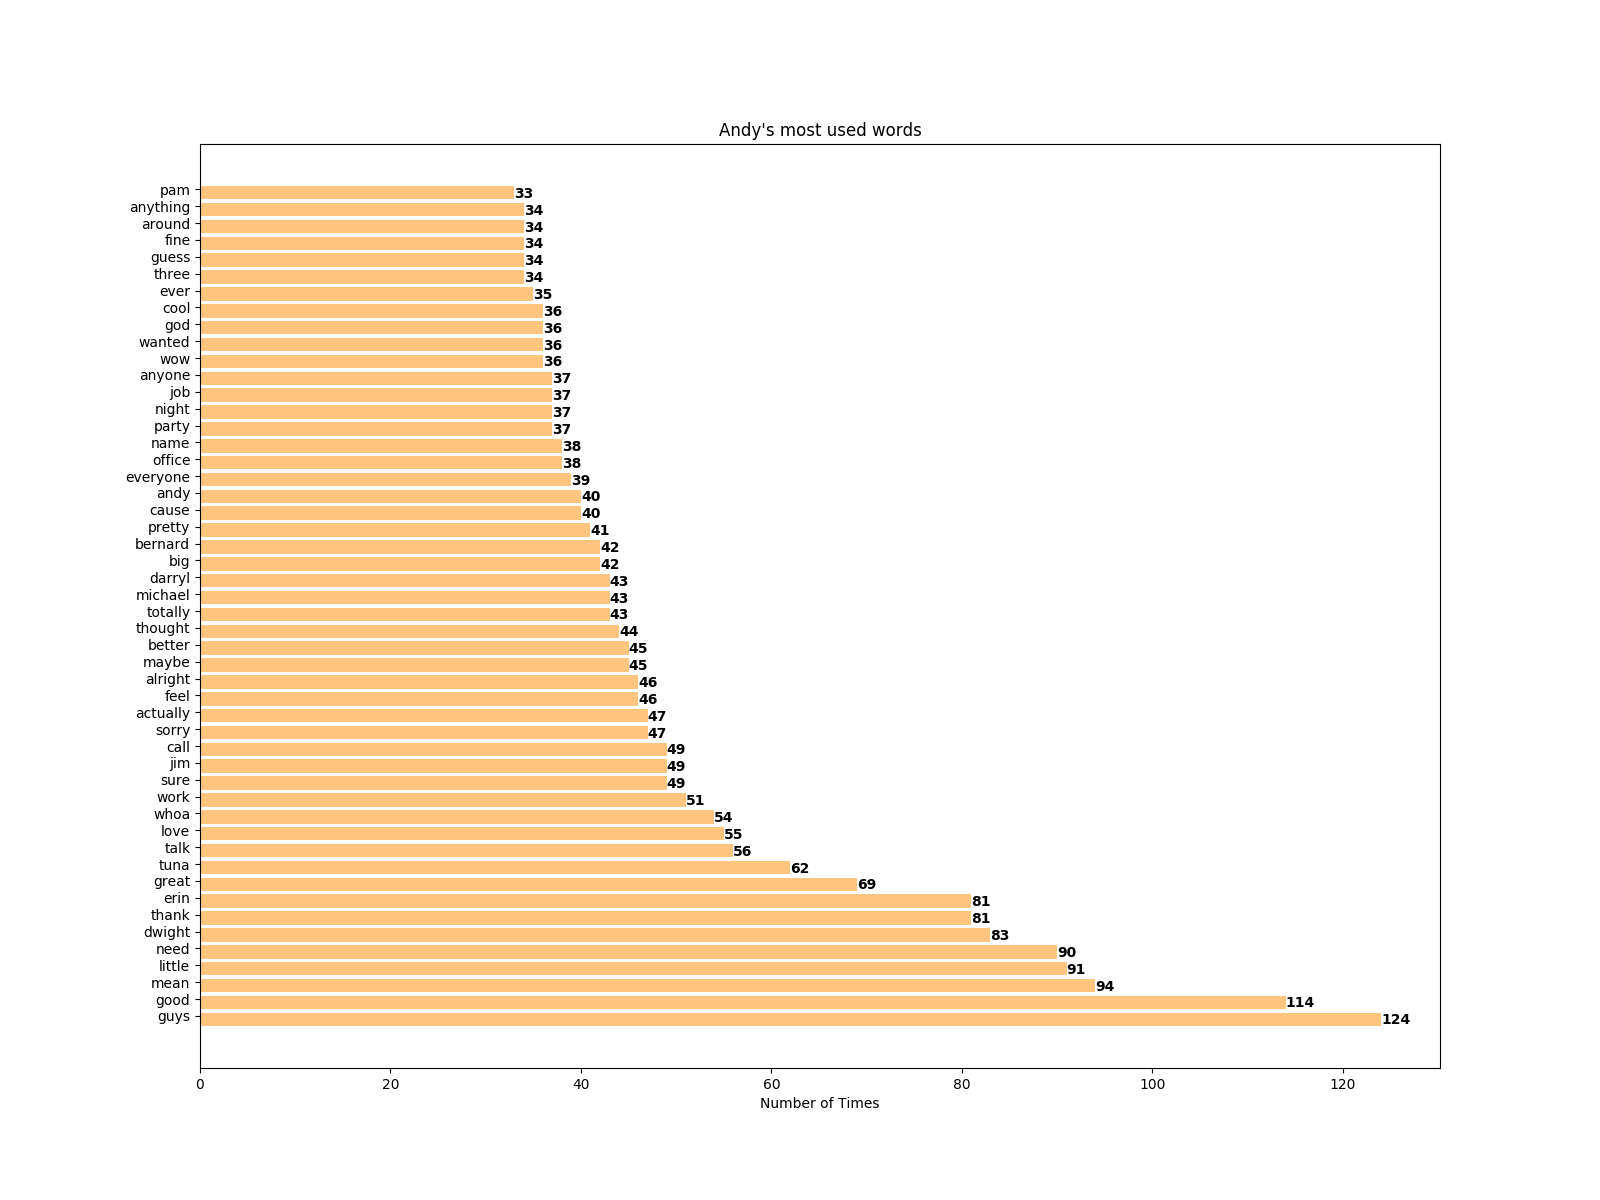
Kevin:
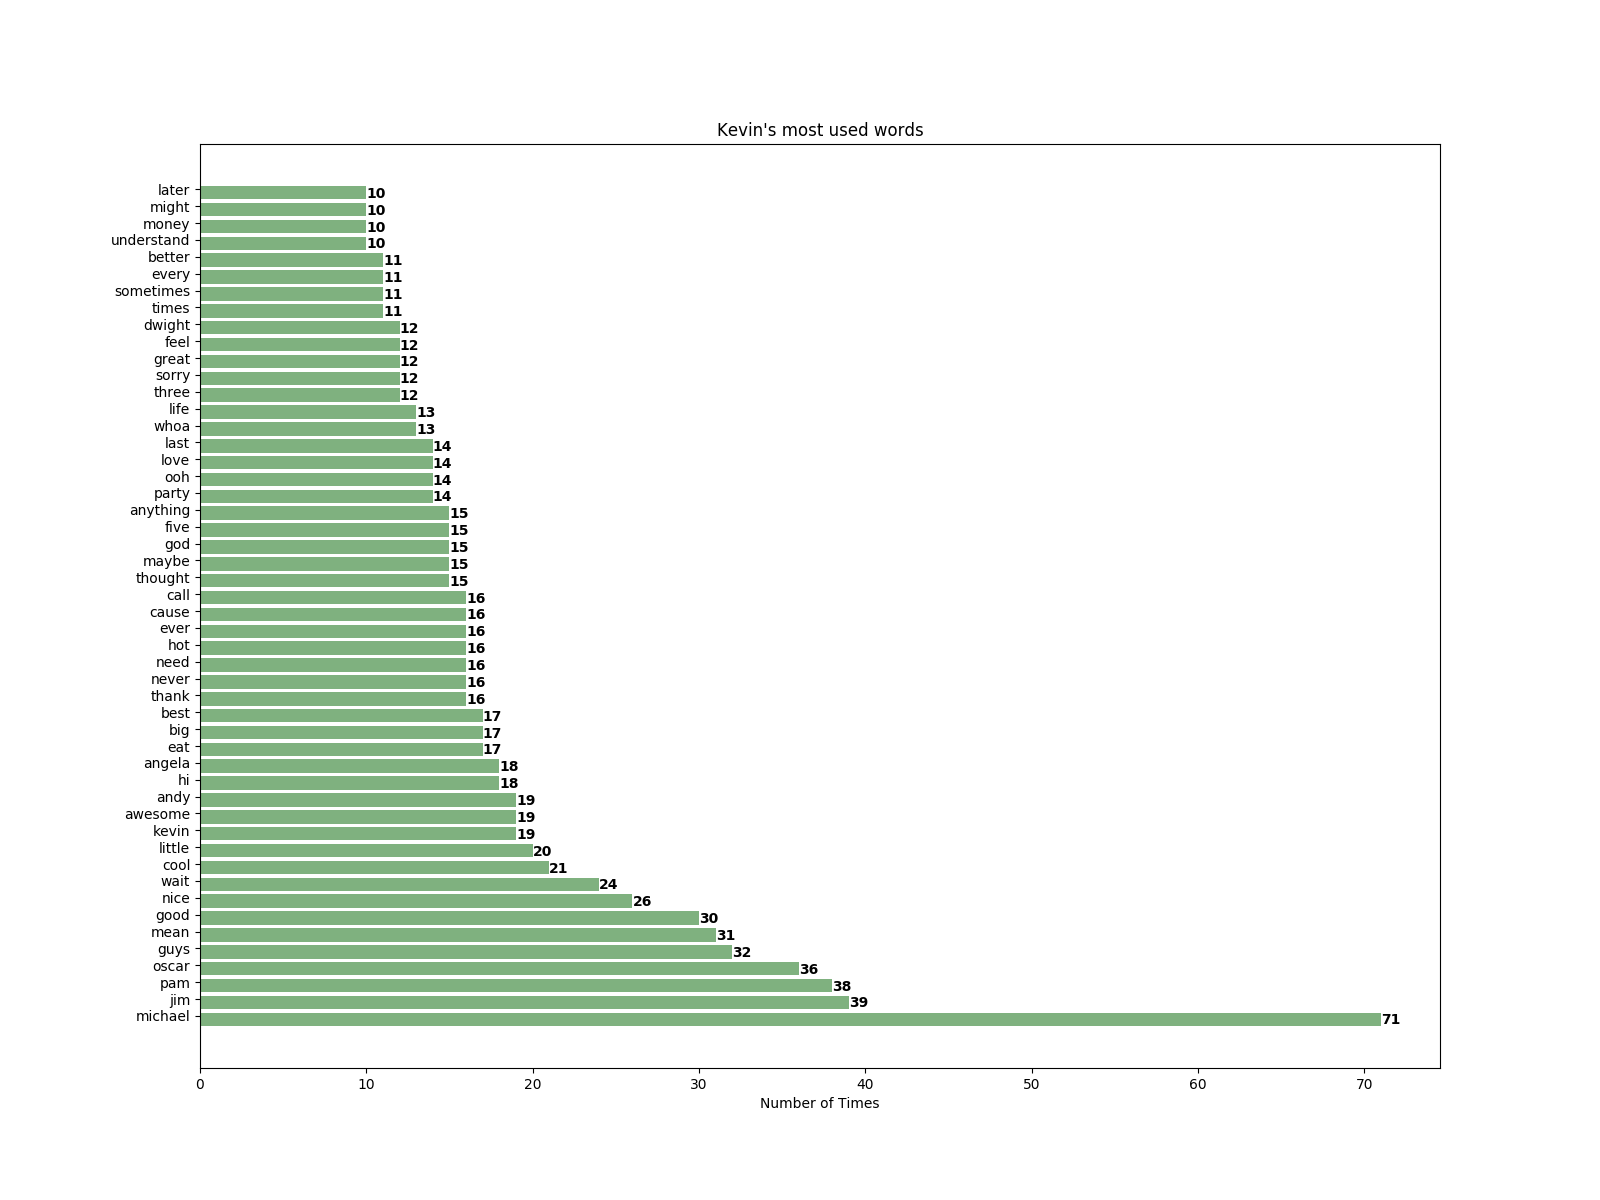
Angela:
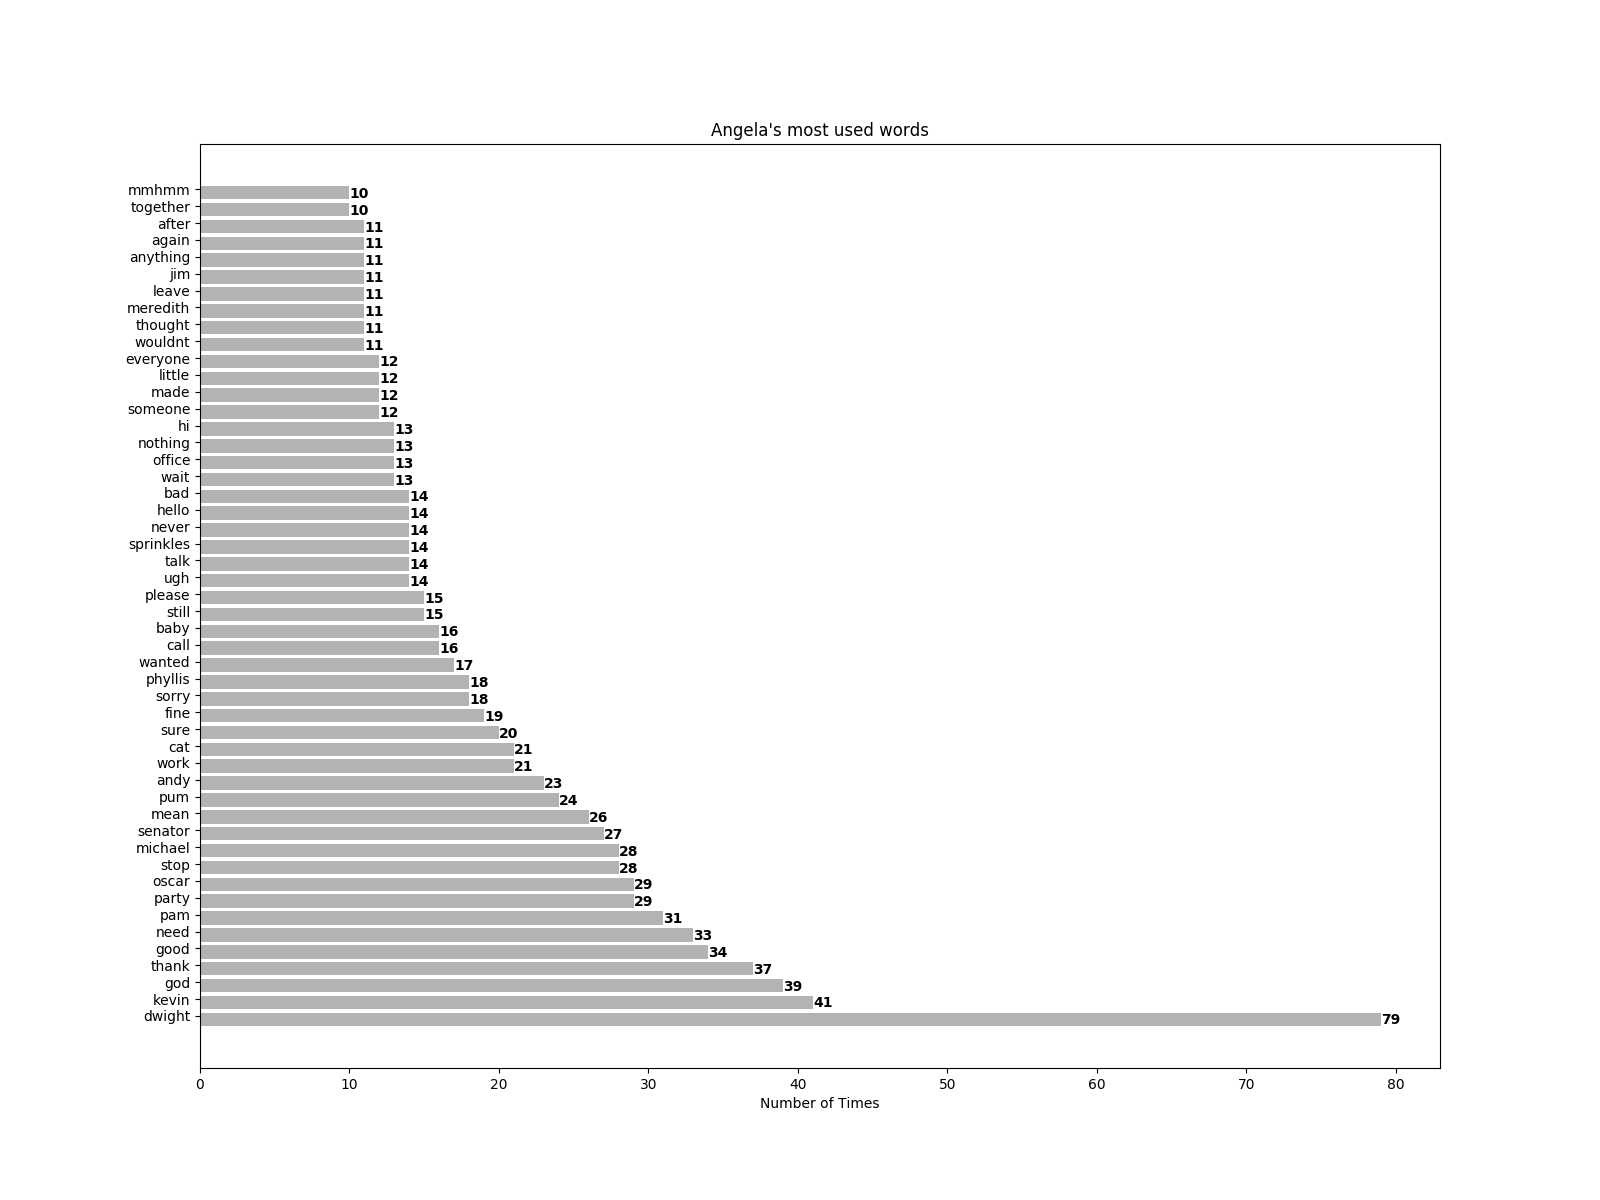
Erin:
Oscar:
Darryl:
Ryan:
Phyllis:
Kelly:
Toby:
Stanley:
Meredith:
Creed:
Technical Discussion
First off, the source code that generated all the above graphs (except for the music frequency one, as that was done by hand) can be found here.
Parsing the Episodes
Probably the most interesting/difficult part of this was getting the actual contents of the episode and processing through them appropriately. For this, the website OfficeQuotes was huge, as it provides all the episodes in a constant format and at consistent links. Parsing through the contents of requests to the URL’s was a bit difficult, so I’d like to draw special attention to this section of the code linked above:
# clever part - each page assigns bgcolor right before script starts
# this line saves a lot of time that is otherwise 100% wasted
txt = f.text[f.text.index("<td bgcolor=\"#FFF8DC\" valign=\"top\">"):]
# regex to discard all html tags
txt = re.sub('<[^<]+?>', '', txt)
# regex to discard stage cues ie) [looks at camera]
txt = re.sub("\[.*\]", "", txt)
# split on each line of dialogue
txt = txt.split('\n')

for t in txt:
  # regex to discard tabs and carriage returns
  t = re.sub('[\t\r]+', '', t)
  # regex to discard all punctuation - needlessly splits up words
  t = re.sub('[^\w\s]','',t)
  # split each line on all the words
  line = t.split(' ')
Here, f is a response object received as a call through the wonderful requests API. First, looking into example responses from the site showed that right before the start of the episode was where they assign #FFF8DC to the bgcolor. Replacing the text with the result of searching for this substring and starting from that index saves over half the time processing, as for my purposes there was a lot of filler that was functionally useless.
Next, there are many regular expression substitutions used in here. These are to rid the input string of all HTML tags, character instrucitons, new line, tabs, and carriage returns. Again, this is not the only way of clearing these from the character’s dialogue to focus on just the words, but it was extremely wasy with basic knowledge of Regular Expressions. If these are new to you, I’d highly recommend looking at the ones used above and testing them out on a site like RegExr.
Once I had this section done, I had each character’s line of dialogue in an easy to iterate list. Finishing the process was just a matter of converting it to lowercase and adding it to the correct character dictionary in the correct fashion, then grabbing the top 50 words from each dictionary with a simple function def top50(character):.
Stop Words
Stop Words are a really interesting problem in computing, which is basically “How do you remove the common words people don’t really consider interesting without removing significant ones?” For purposes of this project, I kept it simple in this regard. I started with an initial list of the 100 most common words in English and ran the program to generate graphs. From here, it was a matter of running the program ~10 more times and eliminating words it was pretty obvious no one cared about - things like “whats”, “id”, and “whose” (remember I discarded all punctuation and made everything lowercase!). It’s an admittedly non-technical approach, but ultimately I was happy with the results and in reading about algorithms on the stop words problem I couldn’t find one that wouldn’t also remove the word “michael” when removing “what”, for example.
Here is a full list of the stop words I used(for simplicity purposes I used a dictionary and mapped all of their values to 0, but that number is not significant):
a, about, all, also, and, as, at, be, because, but, by, can, come, could, day, do, even, find, first, for, from, get, give, go, have, he, her, here, him, his, how, I, if, in, into, it, its, just, know, like, look, make, man, many, me, more, my, new, no, not, now, of, on, one, only, or, other, our, out, people, say, see, she, so, some, take, tell, than, that, the, their, them, then, there, these, they, thing, think, this, those, time, to, two, up, use, very, want, way, we, well, what, when, which, who, will, with, would, year, you, your, , i, is, are, dont, im, oh, okay, was, right, going, uh, um, something, things, down, over, where, off, lets, theres, much, doing, guy, gonna, does, put, why, whats, doesnt, lot, cant, theyre, any, id, wont, own, said, whos, wasnt, thats, yeah, am, hey, yes, youre, ok, were, did, an, has, had, really, hes, got, back, didnt, been, ive, shes, ill, us, should, too, let
Graphing
The final step in this was actually creating a grpah out of the words gotten from processing the dialogue. I went with the tried-and-true MatPlotLib for this task, as I am realtively new to the world of data creation in Python and wanted to keep it simple. Again, we can look at the relevant section of code from the above GitHub link(with the section on color left out for brevity):
def show_graph(character, name):
  # set up graph
  y_pos = np.arange(len(character))
  # get words and frequency from tuple
  c1 = [f[0] for f in character]
  c2 = [f[1] for f in character]
  # ax needed for putting number on bar graphs
  fig, ax = plt.subplots()
  # create actual bar graph
  plt.barh(y_pos, c2, align='center', alpha=0.5)
  width = 0.4
  # label bars with their number
  for i, v in enumerate(c2):
    ax.text(v, i-.3, str(v), color='black', fontweight='bold')
  # generate y tick intervals
  ax.set_yticks(y_pos+width/2)
  # label words
  ax.set_yticklabels(c1, minor=False)
  # x label (y label not given to avoid clutter)
  plt.xlabel('Number of Times')
  # generate title from parameter (other ways to do, this is easiest)
  plt.title('{}\'s most used words'.format(name))
  # set size for plot
  plt.rcParams["figure.figsize"] = fig_size
  # save the fig (comment for debugging)
  plt.savefig('{}.png'.format(name))
  # show the fig (comment for publishing)
  #plt.show()
Which takes in character, a list of size-2 tuples(with each tuple being a word and its frequency), and name, a string of the character’s name, and then saves/shows a plot of that data. With this background, the code becomes pretty clear. I gave a fair amount of consideration to things like whether the bars in the bar graph should have their number corresponding to them and/or a grid behind them, and ultimately am pretty happy with the decision here. Someone much better at design could likely make these graphs much better looking, but I will leave that to the reader.